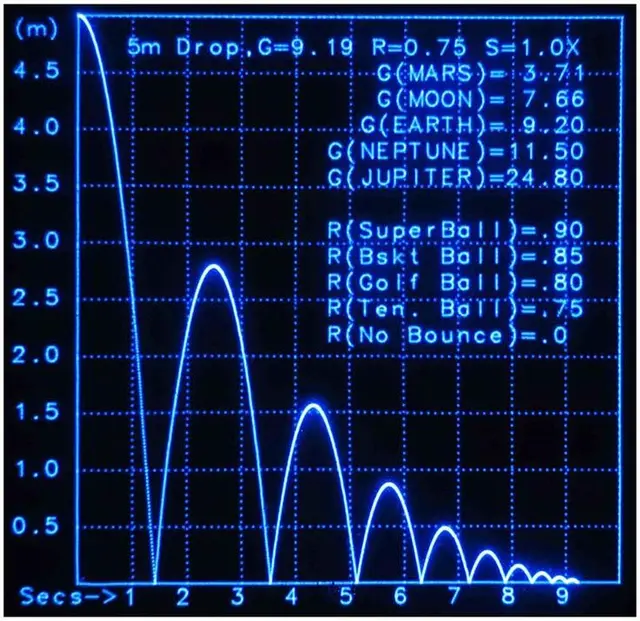
CRT-style cyan plot of successive bounces from a 5 m drop
Description
Retro neon-cyan CRT graph showing bounce heights vs time for a 5 m drop. The plot displays successive peak heights (decaying oscillations) on a gridded axis,...
Tags
Concepts
Style
Colors
- #000020
- #002040
- #000000
- #002060
- #2040a0
- neon cyan
- navy blue
- black
Text In Image
5m Drop, G=9.19 R=0.75 S=1.0X G(MARS)=3.71 G(MOON)=7.66 G(EARTH)=9.20 G(NEPTUNE)=11.50 G(JUPITER)=24.80 R(SuperBall)=.90 R(Bskt Ball)=.85 R(Golf Ball)=.80 R(Ten. Ball)=.75 R(No Bounce)=.0 (m) Secs-> 1 2 3 4 5 6 7 8 9
More like this